Home
Great Shift Table of Contents/Summary
Preparing Yourself No
Catastrophic Earth Changes
Your Soul Origins About
Russell Newsletter
Contact Us
![]()
Earth Changes Data Graph #2: Increased Volcanic Activity
Posted September 15, 2005
Updated February, 2009
Updated June 2012
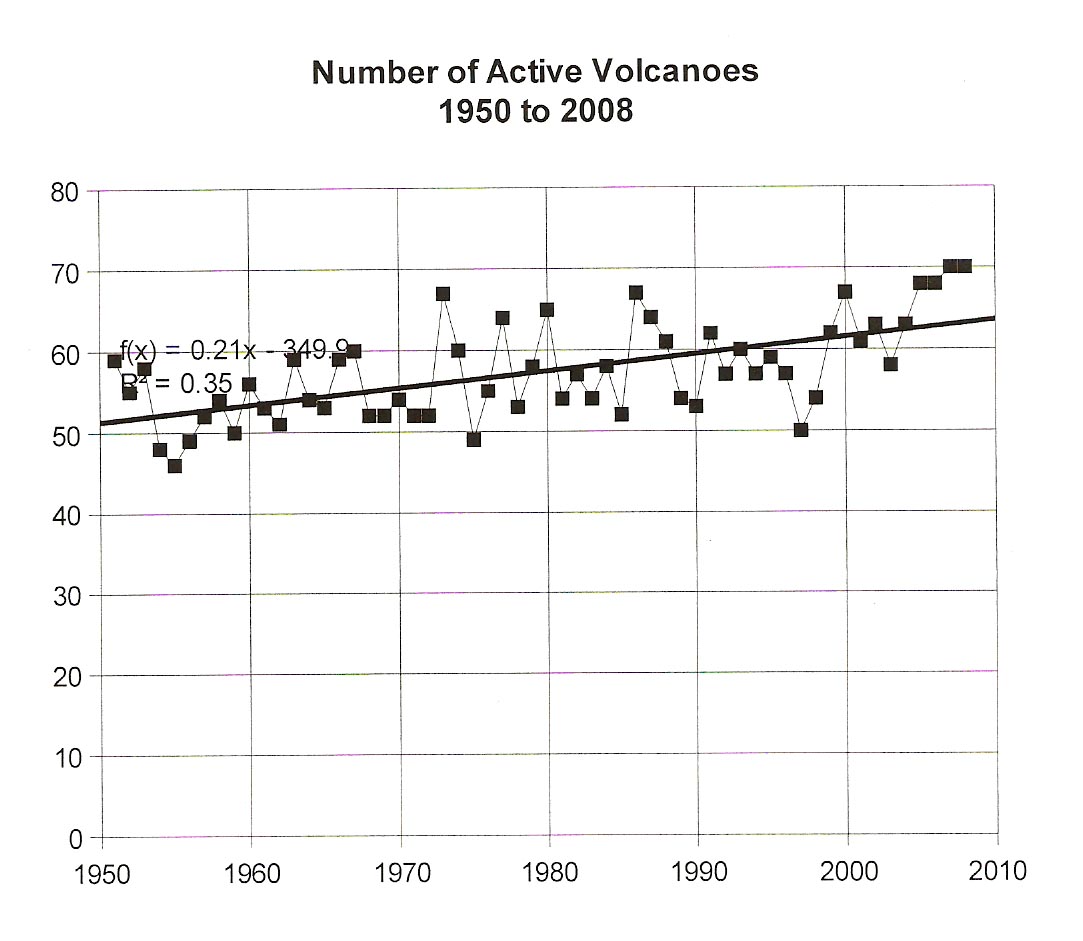
Updated July 2012Update: The volcanic activity graph has been updated through 2008 (see below). Since 2004 the upward trend has continued, with the last two years the highest ever recorded in a year (70). The latest regression analysis suggests that another active volcano is added to the total every 4.8 years (compared to every 6.4 years in the 2004 regression analysis).
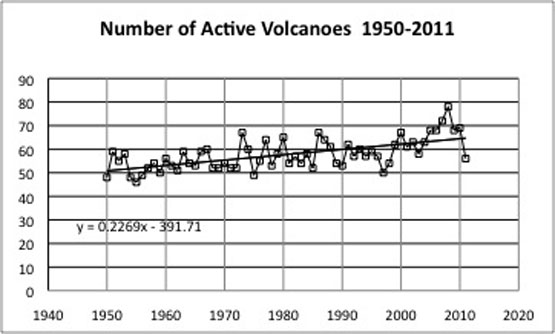
In addition to increased earthquake activity, higher dimensional sources suggest that increased volcanic activity is another manifestation of the stress that Mother Earth is experiencing as part of the dimensional shift that is now taking place. The Smithsonian Institution's Global Volcanism Program (GVP) maintains a searchable database of world-wide volcanic activity, and the figure below shows that there has been a gradual rise in the total number of active volcanoes each year since 1950 (the earliest date for which comprehensive data are available). This is not a dramatic upward trend, but statistical regression analysis suggests that another active volcano is added to the total every 6.4 years. The interesting thing is that if you go to the "frequently asked questions" page of the GVP website, it said in 2005 that there did not appear to be any evidence of increased volcanism and showed a graph with a flat regression line. When I checked in 2021 it presented a completely different piciture: Has volcanic activity been increasing?.
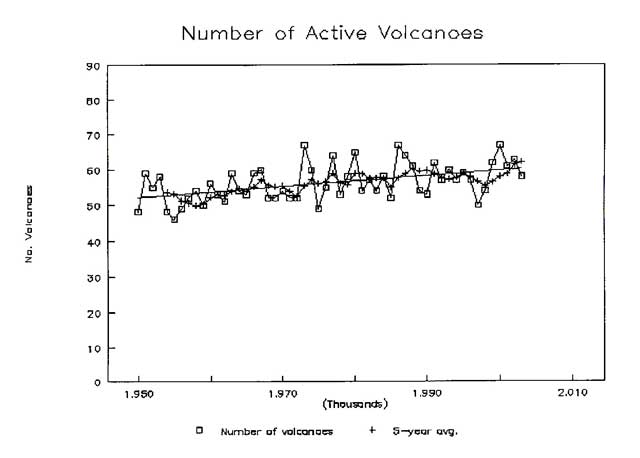
Update, June 2012: Since I last updated this graph the upward trend has become even more pronounced with an addition of one volcano every 4.4 years since 1950 and a record high of 78 volcanoes in 2008). The Global Volcanism Program website continue to respond to the question Has volcanic activity been increasings? with a We don't think so, and continues to shows a plot of number of active volcanoes from 1950 to 2000 with a flat best-fit regression line. From 1950 to 2000 an average of 56.0 volcanoes erupted each year. In contrast, the average was 65.8 during last ten years, almost ten volcanoes/year more than in the previous fifty years.
As far as I know, an increase in volcanic activity in the last fifty years does not fit any mainstream scientific model of global tectonics. Alternative scientist Michael Mandeville has presented even more dramatic evidence of increased volcanic acitivity in the last 50 years by plotting the number of combined days of activity of major volcanoes from 1975 to 1993. His graph below shows that from 1875 to around 1947 total days of eruptive activity fluctuated around 1500. From 1947 to 1975 there was about a four-fold increase to 6000 days of eruptive activity and from 1975 to 1993 the value fluctuated around an average of about 5000 days. Mandeville relates volcanic activity to a 6.5 year wobble in the Earth's axis (not convincingly to my mind), but he presents other interesting additional data on his website related to increased earthquake activity that is consistent with my own analylsis www.michaelmandeville.com):